Local News
The Jewish population in Winnipeg is far more spread out than used to be the case, according to 2021 census
By BERNIE BELLAN The latest census data shows that the Jewish population in Winnipeg is now far more spread out than used to be the case years ago, when the vast majority of the Jewish population was divided between the north and south ends of the city.
Now, according to information that was released in November 2022 by statcan, Jews can be found in almost all areas of the city.
We’ve been analyzing data from the 2021 census ever since statcan released a trove of data about the ethnic and religious composition of Canada in November.
The 2021 census is the most accurate census we’ve had in Canada since the National Household Survey in 2011. In our November 23rd issue we showed how the Jewish population of Winnipeg could not be more than 14,270 and was very likely much smaller than that. What we did is take the number of respondents to the 2021 census who said that one of their ethnic origins was “Jewish”, and compared that with the number who said their religion was “Jewish.”
As we noted then, the number of respondents who said their religion was “Jewish” was 11,170, while the number that gave at least one of their ethnic origins as “Jewish” was 10,700. It might be complicated to understand, but we showed that, while many of the individuals gave one of their ethnic origins as “Jewish,” they also reported a different religion than “Jewish.” As a result, we concluded, the maximum possible number of individuals in Winnipeg who could be Jewish was 14,270 – although we also showed that the true number was likely much smaller than that.
Following our initial foray into an analysis of the 2021 census we kept up a correspondence with a statistician from statcan (which is now the name for what was formerly Statistics Canada), asking whether it would be possible to produce figures for where Jews live in Winnipeg. Subsequently, we were sent a table that listed Jewish population according to religion within the many census tracts in Winnipeg, also a map showing census tracts in the city.
By cross-referencing the table that was sent to us with the map that was also sent we were able to produce our own set of figures showing where Jews live in the city. Some of the figures that resulted might come as a great surprise to readers, including the huge drop in the Jewish population of West Kildonan (down to 205) and the very substantial increase in the number of Jews that live east of the Red River. (There are now almost as many Jews in East Kildonan – 175, as West Kildonan! And, when you add in Jews living in other parts of the city east of the Red River, you realize that approximately 10% of the Jewish population in Winnipeg now lives east of the Red River.)
We were also surprised to learn that Tuxedo has almost overtaken River Heights as the area with the largest concentration of Jewish population in Winnipeg, with the area known as Crescentwood coming in third.
In producing our own map and corresponding table we were able to show how areas in the extreme south end of the city, including south St. Vital and Bridgewater, have become home to very large Jewish populations. (That map can be seen on our website: jewishpostandnews.ca.)
In fact though, our Jewish population is now so spread out in so many different areas of the city that it would be difficult to say, as had been the case for many years, that our Jewish population is concentrated in the “south end” of the city. Traditionally, when we thought of the “south end,” we tended to think of River Heights and Tuxedo, also – in more recent times, Lindenwoods and Whyte Ridge.
As it turns out, however, there are now Jewish populations in suburban areas in almost all parts of the city, also a fairly large concentration in Wolseley and what is referred to as the West End, both of which are much closer to the centre of Winnipeg.
The continued decline in the number of Jews living in what was the traditional “North End” would probably come as no surprise to most readers, but the fact that there are now only 80 Jews living south of Smithfield, all the way to the CPR tracks, is but one more indication how much Jews have abandoned the traditional North End.
We’re not quite sure why, but the statcan list of census tracts for Winnipeg also included areas that would never be considered part of Winnipeg, such as St. Francois Xavier, Taché, Birds Hill, Lorette, East of Hwy. 59, and St. Clement. We’ve included them here because they form part of the total of 11,165 respondents who declared “Jewish” as their religion in the 2021 census and were considered part of Winnipeg (for some reason) by statcan.
There were also two census tracts that we were unable to identify on the map. They had a total of 20 Jewish residents. We’ve been somewhat arbitrary in identifying certain areas, such as south Fort Garry – not knowing which area would be considered south Ft. Garry and which, north Ft. Garry. The same applies for St. Vital. We’ve also given names to various neighbourhoods where possible, but that was simply not possible in many cases. Tuxedo, for instance, is identified as one census tract on the statcan map, while River Heights is made up of five different census tracts. As a result we were able to distinguish north River Heights (north of Corydon) from south River Heights.
Here then is a list of all areas of the city that have any number of Jewish residents, in order from largest to smallest:
River Heights (south of Corydon) 1460
River Heights (north of Corydon) 530
Total River Heights 1990
Tuxedo 1955
Crescentwood (including Wellington Crescent
& area west of Osborne) 735
Charleswood 660
Lindenwoods 655
Garden City 560
Fort Rouge 410
South Ft. Garry (not including Bridgewater) 360
South St. Vital 355
Whyte Ridge 335
Wolseley 270
Bridgewater 265
Fort Garry (not including Bridgewater or south Ft. Garry) 225
West Kildonan 205
East Kildonan 175
St. Vital (not including south St. Vital) 170
The Maples 165
Transcona 150
St. Boniface 110
North Kildonan 100
Sage Creek 95
Westwood 90
West End (west of Balmoral, north of Portage, east of Polo Park) 85
North End (south of Smithfield, to the CPR tracks) 80
Osborne Village (east of Osborne) 70
Downtown (Portage south to the river)) 60
Island Lakes 60
East St. Paul 45
St. James 45
East of Hwy. 59 45
Birds Hill 40
Silver Heights 35
Riverview 35
Concordia 35
Downtown (east of Balmoral, west of
Main Street, north of Portage, south of Ellice) 25
North-west (between Mollard Road and Selkirk Ave.) 25
Exchange district 25
Headingley 25
Elmwood 20
Waterfront 20
St. Francois Xavier 20
Taché 20
Lorette 20
West St. Paul 15
St. Clement 15
Wildewood 10
Pritchard Farm 10
Armstrong’s Point 10
Local News
Thank you to the community from the Chesed Shel Emes
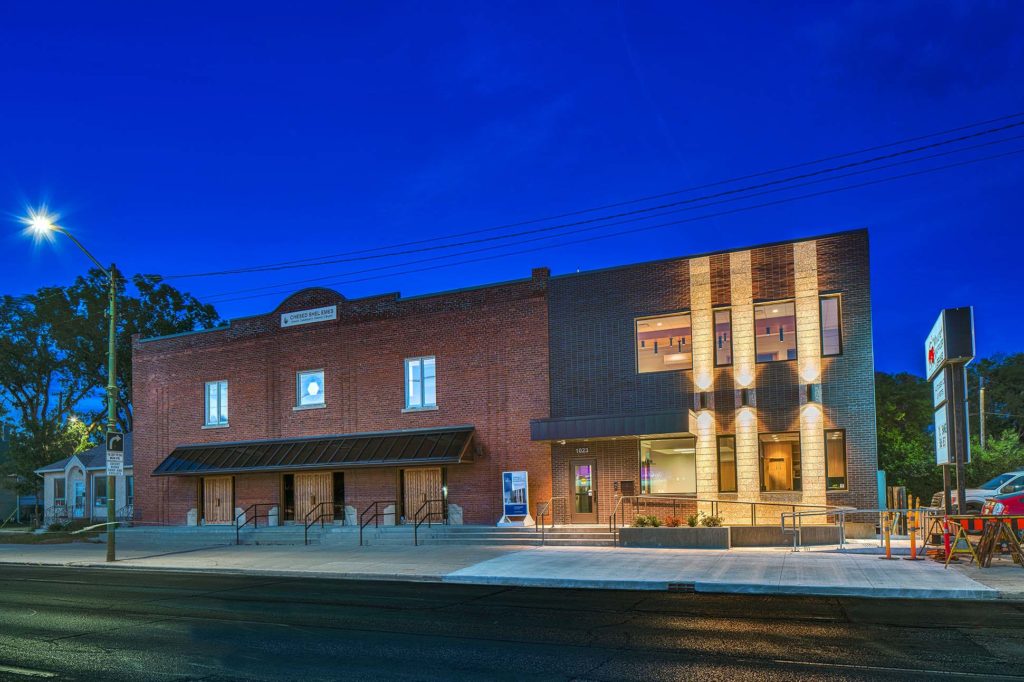
We’re delighted to share a major milestone in our Capital Campaign, “Building on our Tradition.” Launched in November 2018, this campaign aimed to replace our outdated facility with a modern space tailored to our unique needs. Our new building is designed with ritual at its core, featuring ample preparation space, Shomer space, and storage, creating a warm and welcoming environment for our community during times of need.
We’re grateful to the nearly 1,000 generous donors who contributed over $4 million towards our new facility. A $750,000 mortgage will be retired in November 2025, completing this monumental project in just seven years.
We’re also thrilled to announce that our Chesed Shel Emes Endowment Fund has grown tenfold, from $15,000 to $150,000, thanks to you, the Jewish Foundation of Manitoba’s FundMatch program, and Million Dollar Match initiative in 2024. Our fund helps ensure that everyone can have a dignified Jewish funeral regardless of financial need.
As we look to the future, our goal remains to ensure the Chevra Kadisha continues to serve our community for generations to come. Our focus now shifts to replenishing our savings account and growing our JFM Endowment fund.
We’re deeply grateful for your support over the past several years.
It’s our privilege to serve our community with care and compassion.
With sincere appreciation,
Campaign cabinet: Hillel Kravetsky, Gerry Pritchard, Stuart Pudavick,
Jack Solomon, and Rena Boroditsky
Murray S. Greenfield, President
Local News
Winnipeg Beach Synagogue about to celebrate 75th anniversary
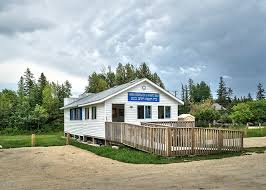
By BERNIE BELLAN (July 13) In 1950 a group of cottage owners at Winnipeg Beach took it upon themselves to relocate a one-room schoolhouse that was in the Beausejour area to Winnipeg Beach where it became the beach synagogue at the corner of Hazel and Grove.
There it stayed until 1998 when it was moved to its current location at Camp Massad.
On August 2nd members of the synagogue will be holding a 75th anniversary celebration.
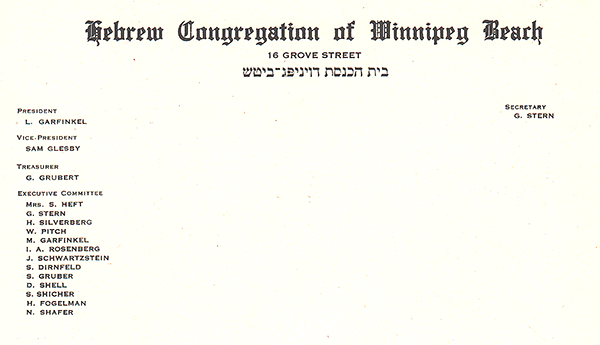
As part of the celebration anyone who is a descendant or relative of any of the original members of the first executive committee (as seen in the photo here) is invited to attend the synagogue that morning.
If you are a relative please contact Abe Borzykowski at wpgbeachshule@shaw.ca or aborzykowski@shaw.ca to let Abe know you might be attending or for more information about the 75th anniversary celebration.
We will soon be publishing a story about the history of the beach synagogue, which is something I’ve been writing about for over 25 years.
Local News
Vickar Family cuts ribbon on new Tova Vickar and Family Childcare Centre
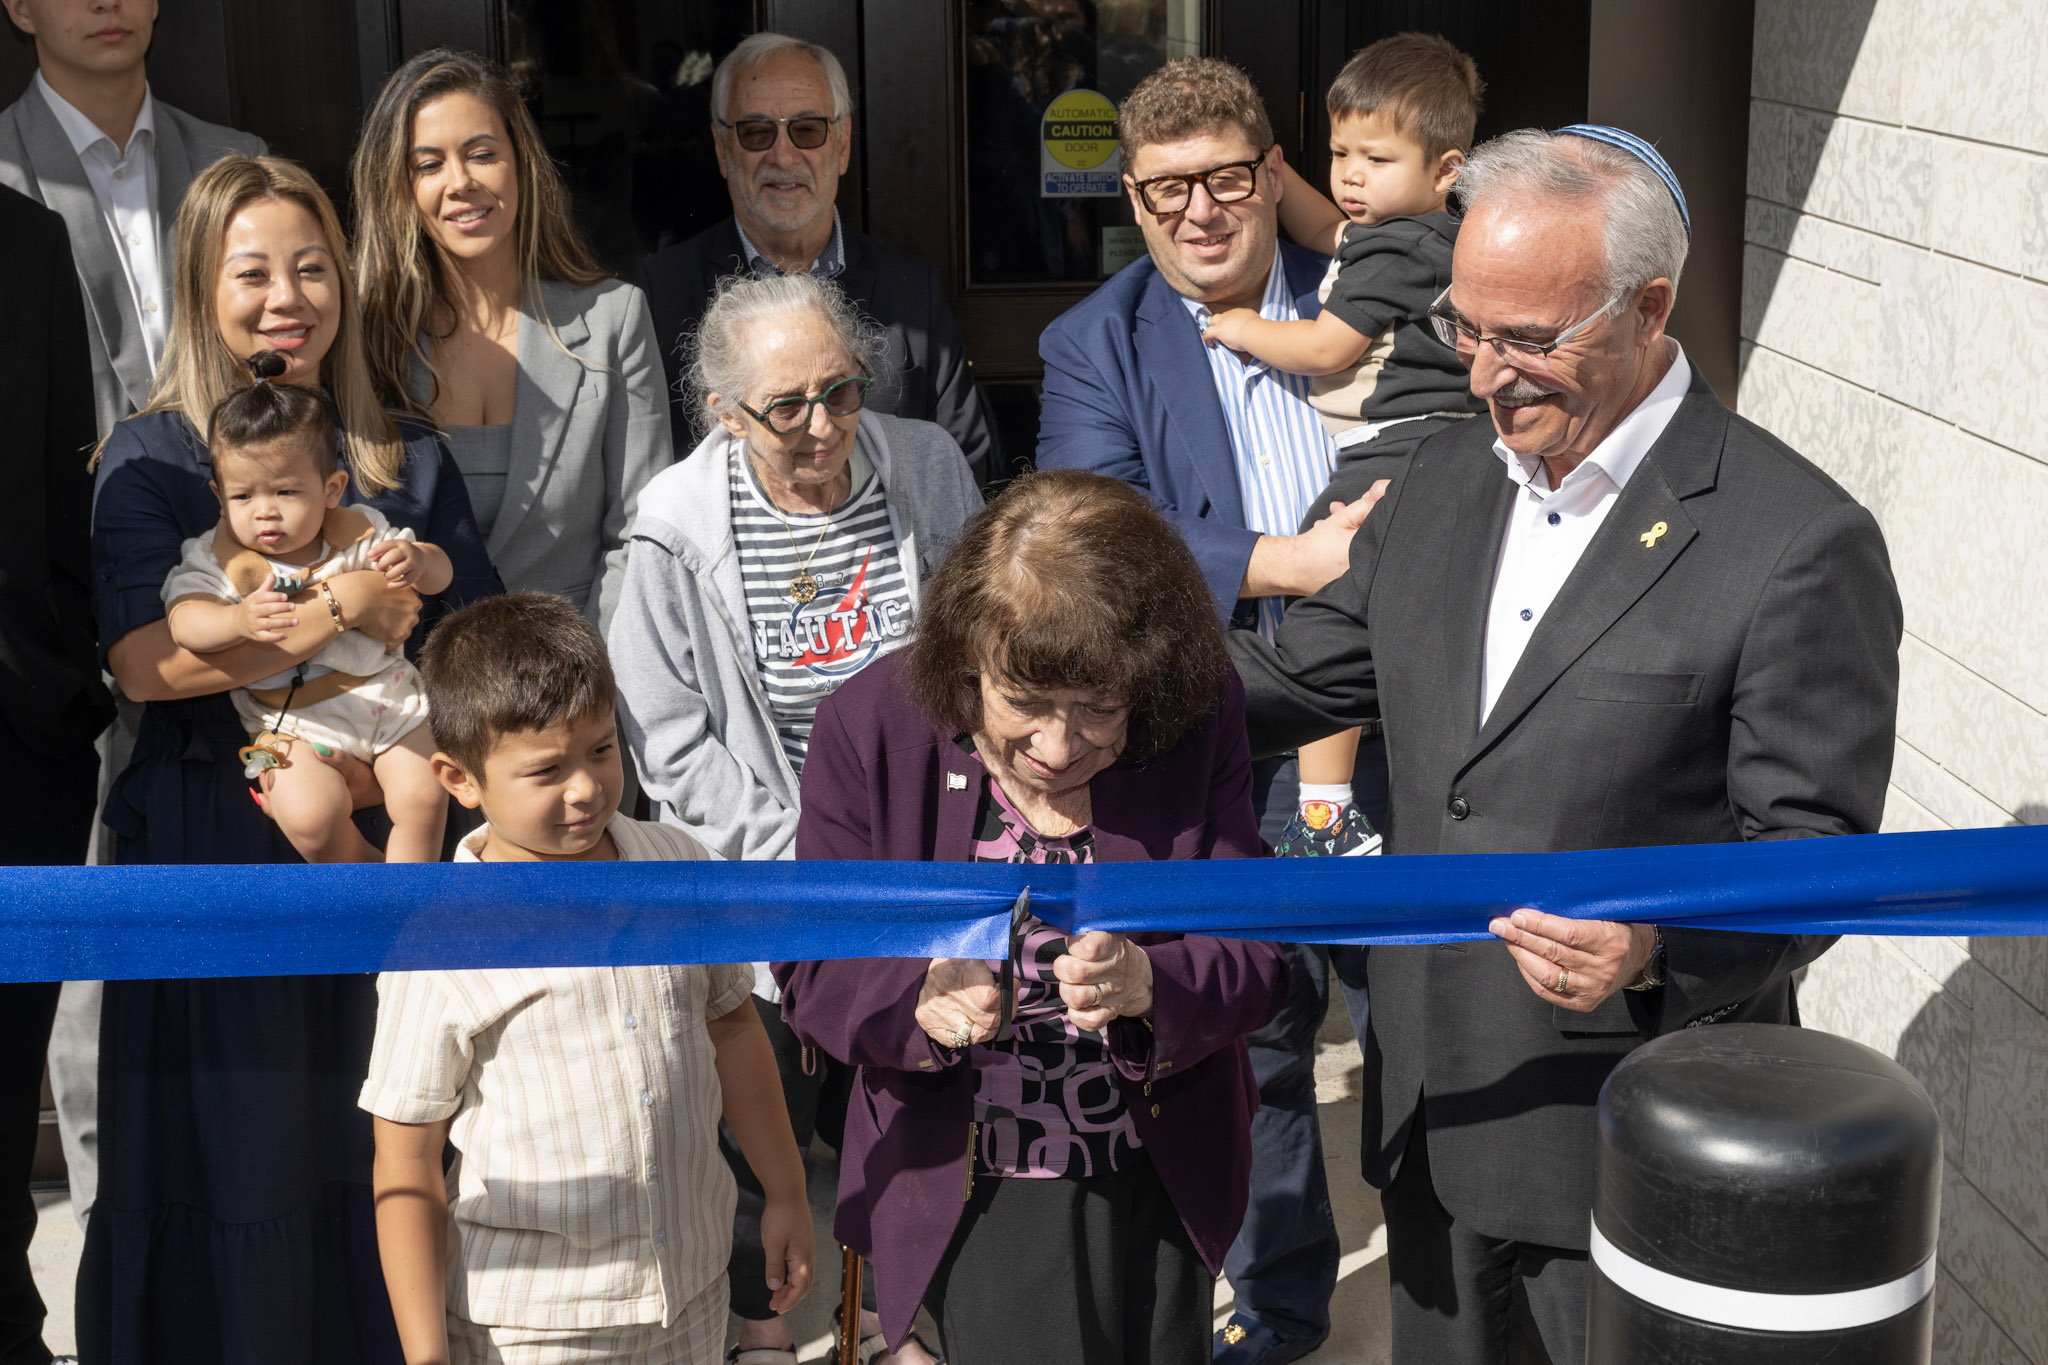
By MYRON LOVE In the words of Larry Vickar, the Shaarey Zedek’s successful Dor V’ Dor Campaign “is not only a renewal of the synagogue but truly a renewal movement of Jewish life in our community.”An integral part of that renewal movement was the creation of a daycare centre within the expanded synagogue. On Monday, June 23, Larry and Tova Vickar cut the ribbon, thereby officially opening the Tova Vickar and Family Childcare Centre in the presence of 100 of their family members, friends and other supporters of the project.
The short program preceding the morning ribbon-cutting began with a continental breakfast followed by a welcome by both Fanny Levy, Shaarey Zedek’s Board President, and Executive Director Dr. Rena Secter Elbaze. In Elbaze’s remarks, she noted that Larry and Tova wanted their family (including son Stephen and family, who flew in from Florida) and friends at the event to celebrate the opening of the Tova Vickar and Family Childcare Centre, “not because of the accolades, but because, as Larry put it, he hopes that their investment in the congregation will inspire others to do the same.”
“When Larry and I spoke about what this gift meant to him and the message he wanted people to take away,” she continued, “I couldn’t help but connect it to the teachings of Reb Zalman Schachter-Shalomi whose book – Age-ing to Sage-ing – changes the whole way we look at the concept of ageing and basing it on our ancestral teachings.”
She explained that his concept of “Sage-ing” is based on three key ideas – Discover your meaning and purpose; accept our mortality and think about the legacy you want to leave.
“Larry spoke about these exact concepts when we met,” she said.
Elbaze also noted the presence of Shaarey Zedek’s newly-arrived senior Rabbi Carnie Rose, former Rabbi Alan Green, and area MLAs Mike Moroz and Carla Compton.
Larry Vickar expressed his great appreciation for all those in attendance. “Tova and I are deeply moved to stand here with you today for this important milestone in our community”, he said. “We are grateful to be surrounded by all of you, the people we care about, our family and friends… you who have touched our lives and played some part in our journey.”