Local News
The number of males and females in Winnipeg’s Jewish population is almost the same, but there are large disparities in certain age cohorts
By BERNIE BELLAN
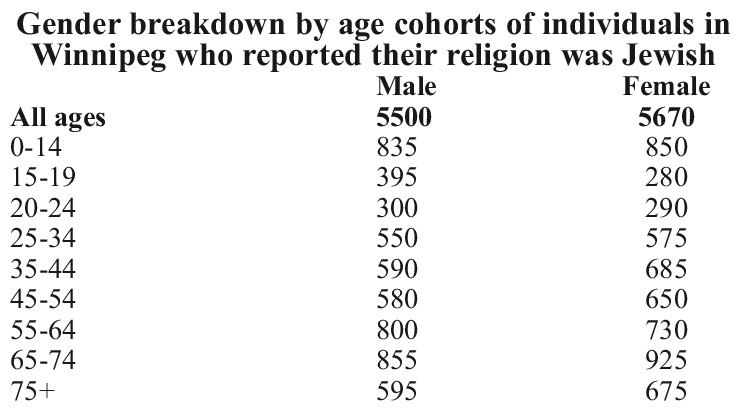
The proportion of females to males within Winnipeg’s Jewish population is almost 50-50 (51.5% female and 48.5% male), according to figures for the number of respondents who reported their religion was Jewish in the 2021 census.
Yet, in the age cohorts 65 and up, women outnumber men by a substantial number (170 more women than men in age groups 65+).
Perhaps somewhat surprisingly though, within the 15-24 age group males outnumber females by a very substantial margin (695 to 570).
Those were two of the more interesting findings to emerge from a study of Jewish population figures in Winnipeg, according to data gleaned from STATCAN.
As I noted in my article on page 1 about trends across Canada as a whole, I’ve been analyzing data produced by STATCAN from the 2021 census. I had requested particular information from STATCAN about Winnipeg’s Jewish population and I was sent tables that were produced specifically in response to my request.
In our last issue I broke down the data that I had been sent by STATCAN insofar as it related to geographic areas, showing that the Jewish population of Winnipeg is very spread out, and that some of the areas traditionally associated with Jewish populations had dwindled substantially – especially West Kildonan, while areas east of the Red River and in the extreme south parts of the city had shown substantial growth in Jewish population.
This time around I was curious to see how the gender divide breaks down according to age cohorts. Again, I relied upon data that was derived from answers to the question about the religion of respondents to the 2021 census. As I’ve noted previously, it would be incorrect to extrapolate the size of Winnipeg’s Jewish population from data about religion alone, since a great many individuals who might be considered Jewish according to ethnic origin might have answered “no religion” on the 2021 census or even that they had a different religion.
Notwithstanding that difficulty, here is a table showing how responses to the question about religion on the 2021 census broke down by gender in different age cohorts, according to those individuals who answered that their religion was Jewish:
Local News
Thank you to the community from the Chesed Shel Emes
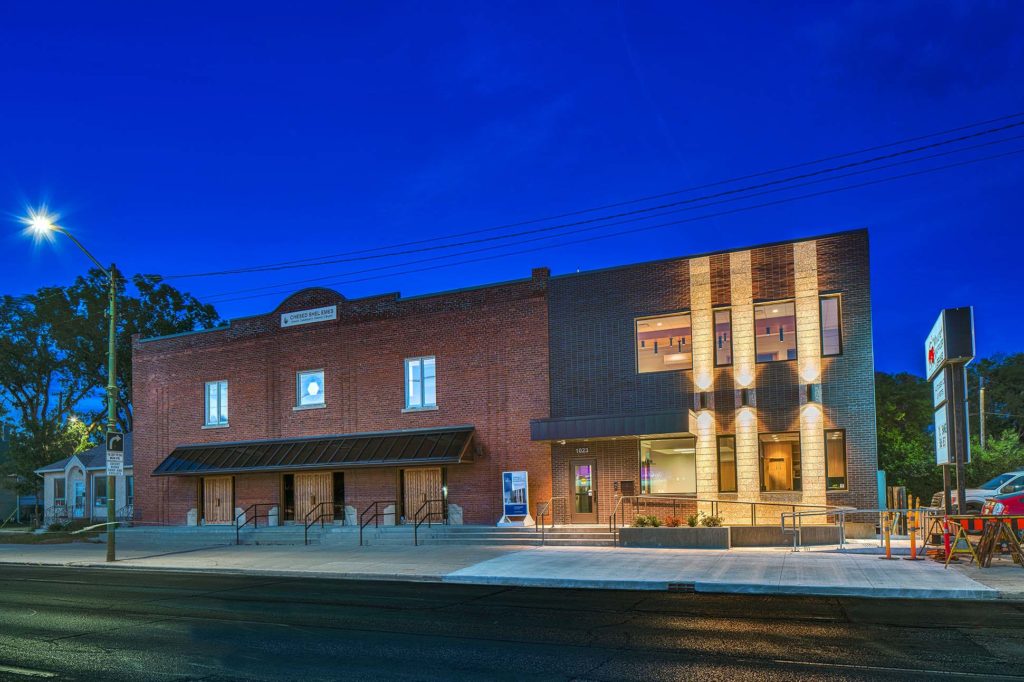
We’re delighted to share a major milestone in our Capital Campaign, “Building on our Tradition.” Launched in November 2018, this campaign aimed to replace our outdated facility with a modern space tailored to our unique needs. Our new building is designed with ritual at its core, featuring ample preparation space, Shomer space, and storage, creating a warm and welcoming environment for our community during times of need.
We’re grateful to the nearly 1,000 generous donors who contributed over $4 million towards our new facility. A $750,000 mortgage will be retired in November 2025, completing this monumental project in just seven years.
We’re also thrilled to announce that our Chesed Shel Emes Endowment Fund has grown tenfold, from $15,000 to $150,000, thanks to you, the Jewish Foundation of Manitoba’s FundMatch program, and Million Dollar Match initiative in 2024. Our fund helps ensure that everyone can have a dignified Jewish funeral regardless of financial need.
As we look to the future, our goal remains to ensure the Chevra Kadisha continues to serve our community for generations to come. Our focus now shifts to replenishing our savings account and growing our JFM Endowment fund.
We’re deeply grateful for your support over the past several years.
It’s our privilege to serve our community with care and compassion.
With sincere appreciation,
Campaign cabinet: Hillel Kravetsky, Gerry Pritchard, Stuart Pudavick,
Jack Solomon, and Rena Boroditsky
Murray S. Greenfield, President
Local News
Winnipeg Beach Synagogue about to celebrate 75th anniversary
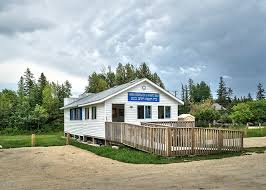
By BERNIE BELLAN (July 13) In 1950 a group of cottage owners at Winnipeg Beach took it upon themselves to relocate a one-room schoolhouse that was in the Beausejour area to Winnipeg Beach where it became the beach synagogue at the corner of Hazel and Grove.
There it stayed until 1998 when it was moved to its current location at Camp Massad.
On August 2nd members of the synagogue will be holding a 75th anniversary celebration.
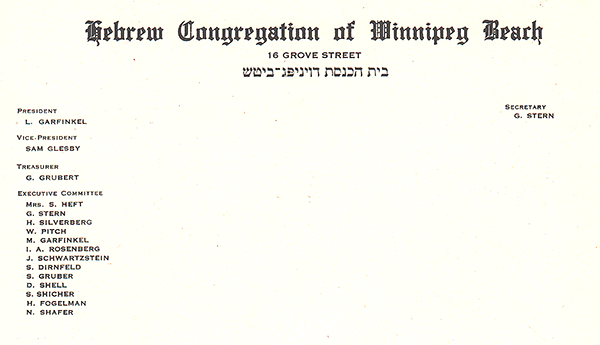
As part of the celebration anyone who is a descendant or relative of any of the original members of the first executive committee (as seen in the photo here) is invited to attend the synagogue that morning.
If you are a relative please contact Abe Borzykowski at wpgbeachshule@shaw.ca or aborzykowski@shaw.ca to let Abe know you might be attending or for more information about the 75th anniversary celebration.
We will soon be publishing a story about the history of the beach synagogue, which is something I’ve been writing about for over 25 years.
Local News
Vickar Family cuts ribbon on new Tova Vickar and Family Childcare Centre
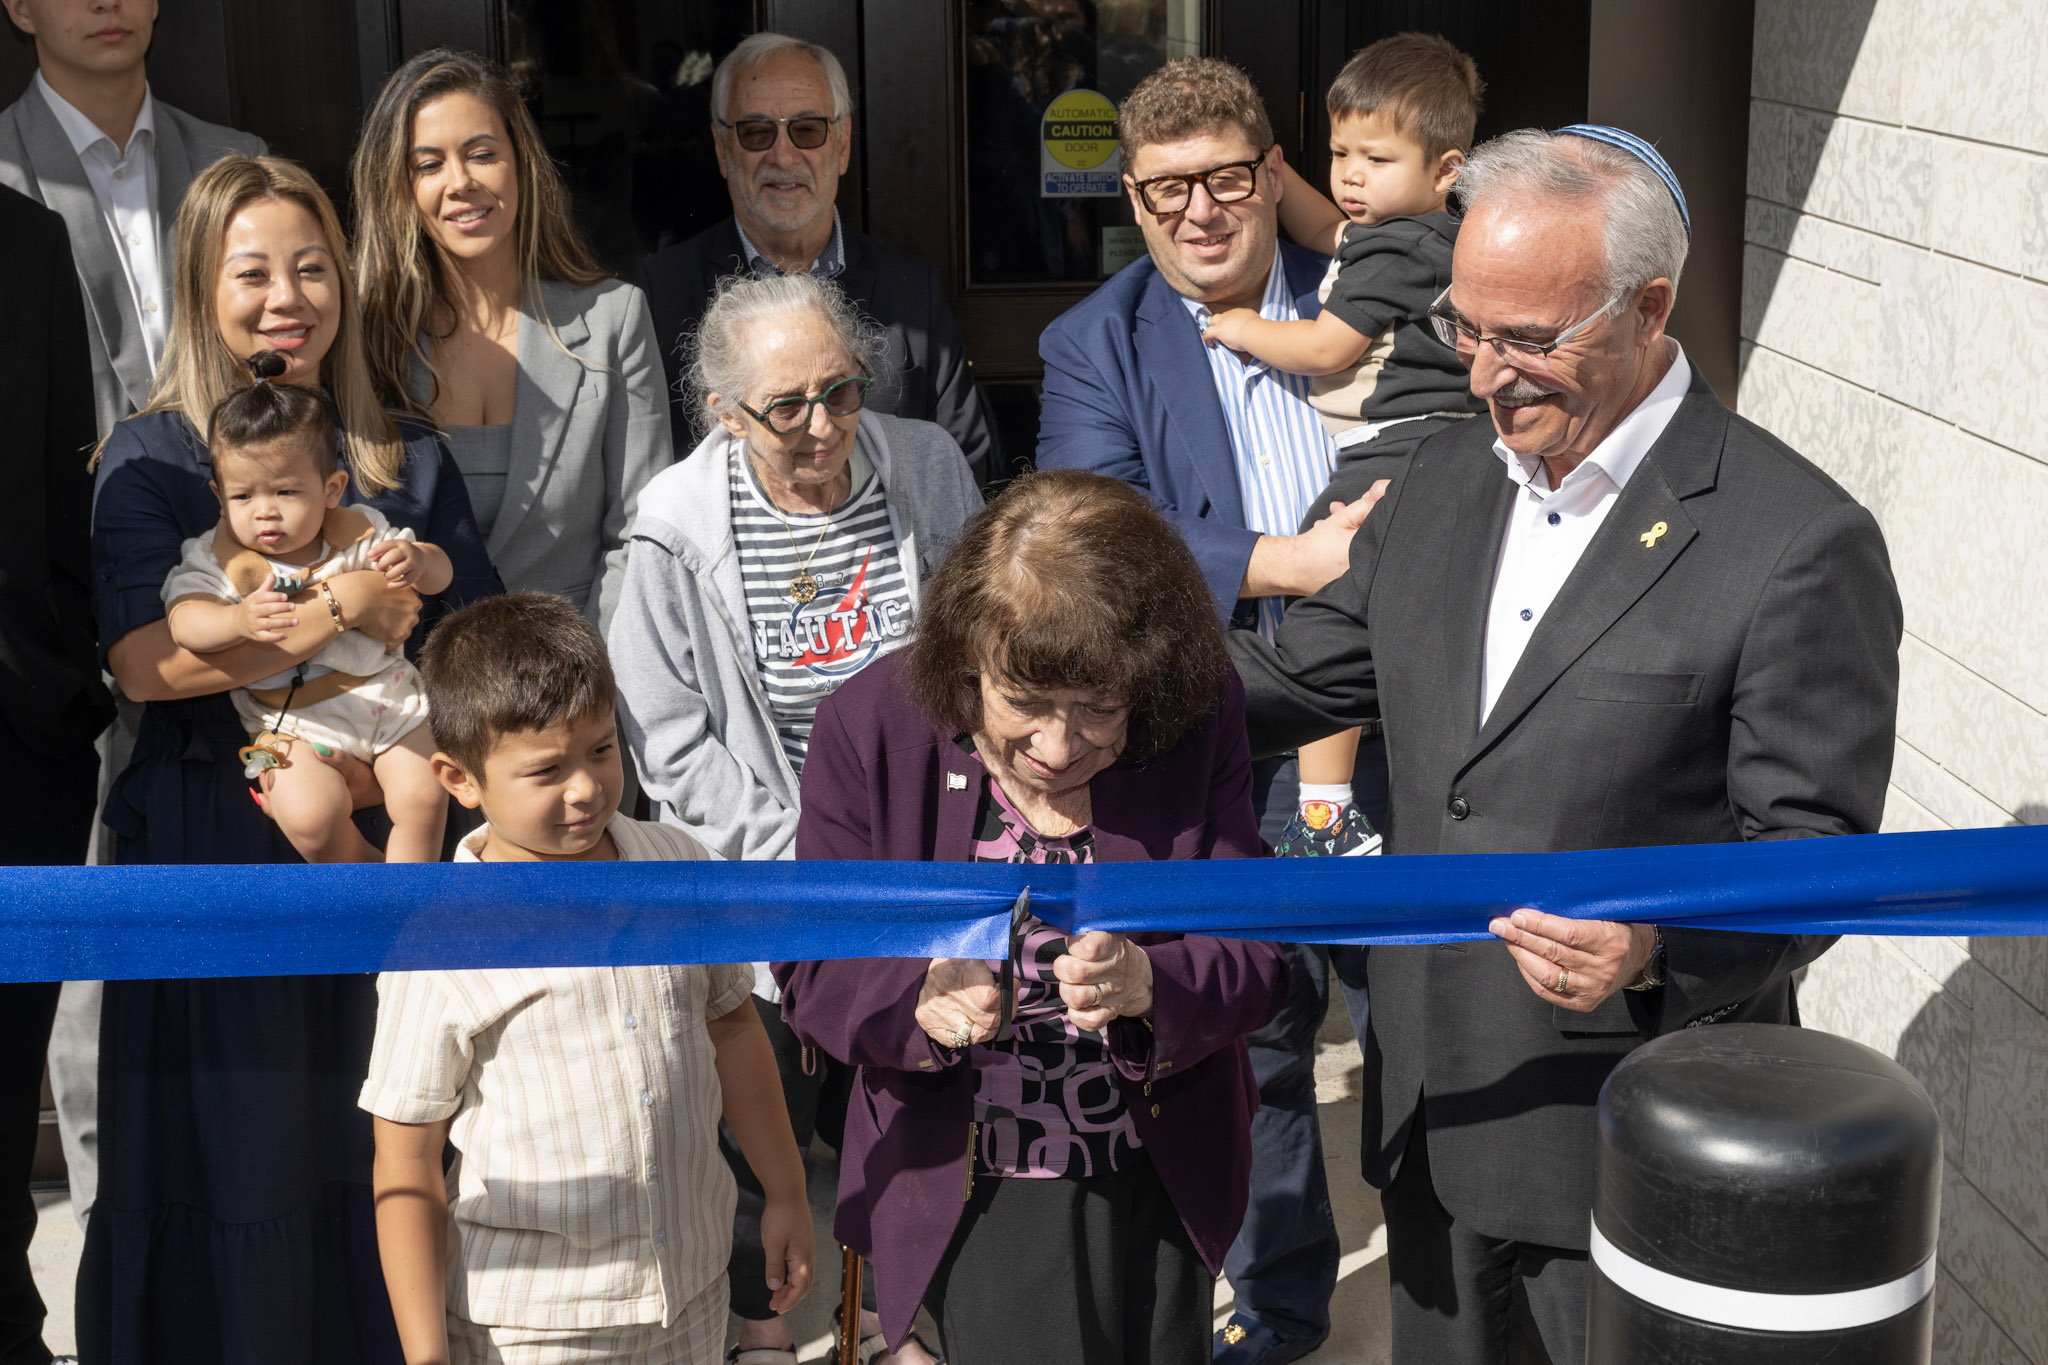
By MYRON LOVE In the words of Larry Vickar, the Shaarey Zedek’s successful Dor V’ Dor Campaign “is not only a renewal of the synagogue but truly a renewal movement of Jewish life in our community.”An integral part of that renewal movement was the creation of a daycare centre within the expanded synagogue. On Monday, June 23, Larry and Tova Vickar cut the ribbon, thereby officially opening the Tova Vickar and Family Childcare Centre in the presence of 100 of their family members, friends and other supporters of the project.
The short program preceding the morning ribbon-cutting began with a continental breakfast followed by a welcome by both Fanny Levy, Shaarey Zedek’s Board President, and Executive Director Dr. Rena Secter Elbaze. In Elbaze’s remarks, she noted that Larry and Tova wanted their family (including son Stephen and family, who flew in from Florida) and friends at the event to celebrate the opening of the Tova Vickar and Family Childcare Centre, “not because of the accolades, but because, as Larry put it, he hopes that their investment in the congregation will inspire others to do the same.”
“When Larry and I spoke about what this gift meant to him and the message he wanted people to take away,” she continued, “I couldn’t help but connect it to the teachings of Reb Zalman Schachter-Shalomi whose book – Age-ing to Sage-ing – changes the whole way we look at the concept of ageing and basing it on our ancestral teachings.”
She explained that his concept of “Sage-ing” is based on three key ideas – Discover your meaning and purpose; accept our mortality and think about the legacy you want to leave.
“Larry spoke about these exact concepts when we met,” she said.
Elbaze also noted the presence of Shaarey Zedek’s newly-arrived senior Rabbi Carnie Rose, former Rabbi Alan Green, and area MLAs Mike Moroz and Carla Compton.
Larry Vickar expressed his great appreciation for all those in attendance. “Tova and I are deeply moved to stand here with you today for this important milestone in our community”, he said. “We are grateful to be surrounded by all of you, the people we care about, our family and friends… you who have touched our lives and played some part in our journey.”